What Are Max Win and Median Max Win in Slots?
When choosing a slot, players often focus on RTP, volatility, and maximum win potential. However, the Max Win metric is frequently misunderstood, while many players only discover Median Max Win after exploring SLOT STAT statistics.
At first glance, both metrics relate to big wins, but in practice they answer very different questions.
Max Win shows the highest payout a slot can theoretically produce according to its mathematical model.
Median Max Win shows the maximum wins that typically occur in real gameplay sessions.

This is why SLOT STAT uses both metrics: one reflects the game’s theoretical potential, while the other reflects its actual behavior.
- What Is Max Win?
- Why Max Win Alone Isn't Enough
- What Is Median Max Win?
- Why Use the Median?
- What Does Median Max Win Show?
- Max Win and Median Max Win in Practice
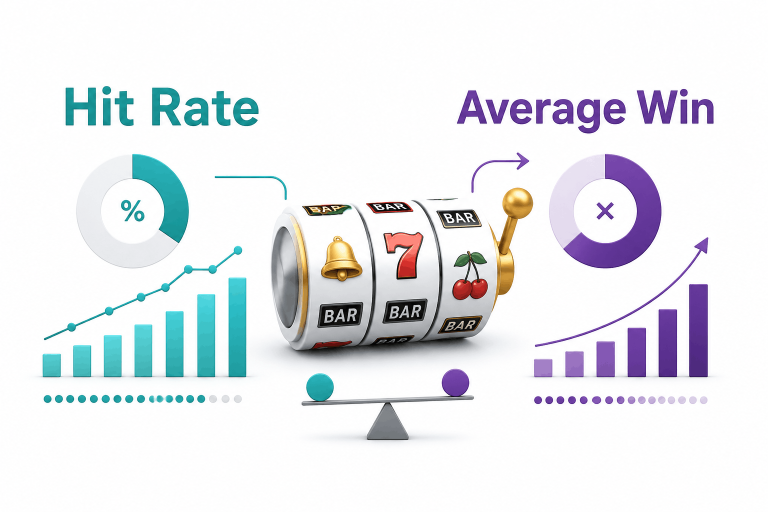
- How Max Win, Median Max Win, Hit Rate, and Volatility Work Together
- How Max Win, Volatility, and RTP Relate to Each Other
- Example: Why RTP Alone Isn't Enough
- How to Use These Metrics Together
- Practical Takeaway
What Is Max Win?
Max Win is the maximum payout a slot can deliver according to its mathematical model. Providers usually express it as a stake multiplier:
For example, if your bet is $1 and the Max Win is x5,000, the maximum possible payout is $5,000.
For many modern slots, a high Max Win is one of the game’s key selling points. This is why providers increasingly release titles with advertised maximum wins of x10,000, x25,000, or even x100,000.
However, it’s important to understand:
Max Win only shows the theoretical payout ceiling and says nothing about how often such wins actually occur.
In many slots, the maximum win is so rare that most players will never experience it during a typical playing lifetime.
Why Max Win Alone Isn’t Enough
Players often compare slots based solely on maximum win potential:
At first glance, a slot with a x50,000 Max Win appears far more attractive. But the real picture can be very different.
Let’s compare two slots:
| Slot | Max Win |
|---|---|
| Fruit Party | x5,000 |
| Gates of Olympus Super Scatter | x50,000 |
Gates of Olympus Super Scatter has a much higher theoretical maximum.
However, if the x50,000 payout occurs extremely rarely while Fruit Party regularly produces wins in the x1,000-x3,000 range, the actual player experience will be completely different.
This is why Max Win is useful for evaluating a slot’s potential, but tells us very little about the large wins players typically encounter in real sessions.
That is exactly where Median Max Win becomes valuable.
What Is Median Max Win?
Median Max Win is the median value of the largest win recorded in each gameplay session during a selected observation period. The calculation is relatively simple:
This approach removes the influence of isolated extreme wins and provides a more stable representation of slot behavior.
As a result, the metric reflects not rare records but the typical level of large wins observed in actual gameplay statistics.
Why Use the Median?
Absolute maximums almost always contain outliers. Imagine the largest wins from ten gameplay sessions:
x80, x95, x110, x120, x130, x150, x180, x220, x300, x10,000
If we use the average value, the x10,000 win heavily distorts the result. The median provides a much more realistic picture.

In this example, the median maximum win is x140, while the average becomes dramatically inflated due to the single x10,000 result. This is why the median often reflects real slot behavior more accurately.
What Does Median Max Win Show?
The metric answers the question:
“What maximum win does a player typically achieve within a single gameplay session?”
It helps reveal:
This is why Median Max Win is often more useful than the provider’s advertised Max Win when evaluating actual slot performance. In simple terms:
Max Win shows the ceiling.
Median Max Win shows reality.
Max Win and Median Max Win in Practice
Let’s look at two slot games.
Provider Data
SLOT STAT Data
Multipliers Distribution
Sweet Bonanza 1000
Provider Data
SLOT STAT Data
Multipliers Distribution
Although Sweet Bonanza 1000 has a significantly higher theoretical ceiling, The Ultimate 5 produces substantial wins much more frequently during ordinary gameplay sessions.
For many players, this information is more useful than Max Win itself.
How Max Win, Median Max Win, Hit Rate, and Volatility Work Together
Individually, each metric reveals only one aspect of a slot’s behavior. They become much more useful when analyzed together.
Profile 1. A Stable Slot
High Hit Rate + Low Volatility + Low Median Max Win
What this means:
This profile is common among lower-risk slots with more stable gameplay dynamics.
Profile 2. Huge Potential, Rarely Realized
Very High Max Win + Low Median Max Win + High Volatility
What this means:
This is one of the most common profiles among modern high-volatility slots.
Profile 3. Aggressive Slot with Genuine Big-Win Potential
High Max Win + High Median Max Win + High Volatility
What this means:
These games are typically considered among the riskiest, but also among the most appealing for players chasing large multipliers.
Profile 4. Frequent Wins with Limited Upside
High Hit Rate + Low Volatility + High Max Win + Low Median Max Win
What this means:
In this case, Max Win reflects the slot’s potential, while Median Max Win reflects its actual behavior.
How Max Win, Volatility, and RTP Relate to Each Other
To properly evaluate a slot, several metrics should be considered together.
RTP
Shows the percentage of wagers that the slot is theoretically expected to return to players over the long run.
Volatility
Shows the payout distribution and the level of variation in results.
Max Win
Shows the highest payout possible within the slot’s mathematical model.
Median Max Win
Shows the typical maximum win observed in real gameplay sessions.
It’s important to understand:
Each metric describes a different aspect of slot behavior.
Example: Why RTP Alone Isn’t Enough
Imagine two slots with the same RTP of 96.5%.
Players will see wins frequently, and session results will be relatively stable.
Provider Data
SLOT STAT Data
Multipliers Distribution
Big Bass Bonanza 1000
Most sessions will be considerably tougher, but the slot is capable of delivering substantial wins from time to time.
Provider Data
SLOT STAT Data
Multipliers Distribution
Despite having the same RTP, the gameplay experience, risk level, and SRP behavior of these slots will be completely different.
How to Use These Metrics Together
The most effective approach is to analyze Max Win and Median Max Win side by side. For example:
High Max Win + Low Median Max Win → enormous theoretical potential that rarely materializes.
High Max Win + High Median Max Win → substantial wins occur relatively regularly.
Moderate Max Win + High Median Max Win → the slot frequently delivers meaningful results even without record-breaking payouts.
This approach helps reveal not only what a slot can do, but also how often that potential is actually realized.
Practical Takeaway
Max Win shows the maximum payout available within a slot’s mathematical model.
Median Max Win shows the maximum wins that typically occur during real gameplay sessions.
If Max Win answers the question:
“What is the highest possible payout?”
then Median Max Win answers:
“What maximum win does a player typically experience in practice?”
That is why both metrics should be considered together when evaluating a slot.
Max Win represents the game’s theoretical potential.
Median Max Win shows how that potential translates into real-world statistics.
In a sense, they represent the theory and the reality of the same slot.