Volatility and Variance in Slots: What They Are and How They Affect Gameplay
Not every player understands what slot volatility actually means or how it differs from RTP. These terms are often mixed up, even though they describe completely different things.
At SLOT STAT, we analyze slot behavior using real statistics (see Method.), not marketing labels.
That’s why we don’t treat volatility as just “low / medium / high” defined by the provider – instead, we evaluate it based on real play sessions and actual data.

- Slot Volatility Explained in Simple Terms
- Volatility Levels: How a Slot Behaves
- What High Volatility Means in Slots
- Volatility vs Variance – Explained in Plain Terms
- Slot Variance: The Mathematical Foundation
- Volatility Classification in SLOT STAT
- How Volatility Affects RTP and SRP
- How to Identify a Slot’s Volatility
- Practical Takeaway for Players
Slot Volatility Explained in Simple Terms
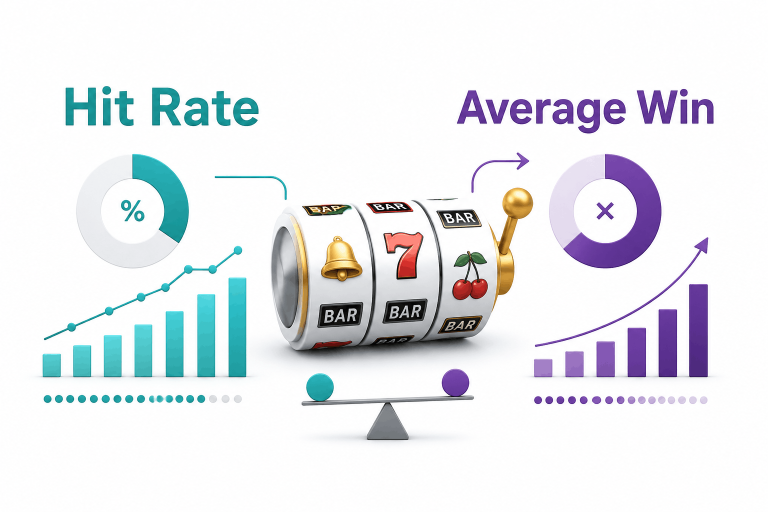
Volatility is all about how wins are distributed: how often payouts happen and how big they tend to be.
In simple terms, it comes down to:
The key point: volatility doesn’t change RTP, but it does determine how much the actual return (SRP) can deviate from it over the short and medium term.
Volatility Levels: How a Slot Behaves
Low Volatility
These slots offer a smooth, steady experience without big swings.
Medium Volatility
A balance between stability and winning potential.
High Volatility
These slots feel more uneven: extended downswings followed by rare but impactful wins.

What High Volatility Means in Slots
High volatility isn’t just a label – it’s a specific gameplay pattern:
It’s important to understand the difference in scale:
within a single session – extended periods with little to no wins
over days or weeks (SRP) – sharp spikes driven by rare big hits
That’s why these slots can:
Volatility vs Variance – Explained in Plain Terms
These terms are often used interchangeably, but they’re not exactly the same.
Volatility is how a slot feels during gameplay
Variance is the mathematical way to describe that behavior
In practice, the relationship is straightforward: the wider the spread of wins, the higher the variance – and the “harsher” the volatility feels.
That’s why statistical measures of dispersion are a practical way to quantify volatility.
Slot Variance: The Mathematical Foundation
Variance describes how much actual results deviate from the average.
In the context of slots, this means how widely the game’s outcomes are spread around the expected value (the mathematical expectation aligned with RTP).
At SLOT STAT, we don’t rely on abstract variance alone – we use its practical form through the standard deviation of wins (σ) (see basic definition) within each game session.
σ is what shows how unpredictable a single session can be: the higher the value, the greater the spread of results – and the more “spiky” or uneven the slot’s behavior feels.
Standard Deviation (σ) per Session
σ = √( Σᵢⁿ (wᵢ − w̄)² / n )
(Population standard deviation, treating the entire session as a full set of observations)
Where:
- wᵢ – the result of the i-th spin (including zero wins)
- w̄ – the average win over the session
- n – the number of spins in the session
")
In SLOT STAT, the unit of analysis is the game session (day/period), not individual spins.
How It’s Used in SLOT STAT (Median Volatility)
We calculate σ separately for each game session (day/period), and then use those values to build an aggregated metric:
Median Volatility = the median of all σ values across sessions
This approach allows us to:
Practical Interpretation
The value of σ is measured in bets (x bets), which makes it possible to compare different slots and sessions on a unified scale.
Low σ → stable sessions with small deviations from the average
High σ → strong fluctuations in results and high unpredictability
Low σ is typical for low-volatility slots, while high σ is found in games where large wins are concentrated in rare bonuses or jackpots.
Volatility Classification in SLOT STAT
We use the following scale:
up to 500 – low volatility
500-1500 – medium volatility
from 2000+ – high volatility
Example: Big Bass Bonanza
Provider Data
SLOT STAT Data
Multipliers Distribution
This scale is built on large datasets of real sessions, which is why Median Volatility provides a more stable estimate compared to averages that can be distorted by rare high-value wins.
How Volatility Affects RTP and SRP
A simple way to frame it:
RTP is the long-term average, while SRP is the actual observed result.
Volatility does not affect RTP as a mathematical expectation, but it defines how results are distributed around it and how large short-term deviations in SRP can be.
In practice:
This explains why a slot with 96% RTP can:
How to Identify a Slot’s Volatility
Providers often label volatility as low / medium / high – but this is only a basic reference point.
You should also consider:
Win behavior
Bonus frequency and size
Game mechanics
Statistical data
Practical Takeaway for Players
Volatility doesn’t define the “quality” of a slot- it describes how payouts are distributed over time and across sessions.
This means:
- A slot can have the same 96% RTP, but:
- either return it through frequent small wins
- or through rare, large payouts
From a practical perspective:
Low volatility
→ suitable for long sessions and a more stable gameplay flow
Medium volatility
→ a balanced option between risk and potential reward
High volatility
→ requires patience and tolerance for long downswings
For bankroll management:
Important note:
Volatility and SRP describe observed statistical behavior – they do not predict future outcomes. Every spin remains an independent event, and while long-term play smooths randomness, it does not eliminate it.