

The Dog House Slot Review
Friendly dogs and a cosy backyard welcome players in The Dog House, a 5×3 video slot with 20 paylines. Wild symbols carry multipliers when they land on reels 2, 3 and 4, and during the free spins round the Sticky Wilds feature locks them in place, helping you rack up bigger wins. On this page you'll find a free-to-play The Dog House demo, win statistics and multiplier distribution, live RTP, and a bet calculator.
Play The Dog House Demo
Claim 500% Bonus up to 500 FS
The Dog House Slot Stats
Provider Data
Min Bet
$0,20
Max Bet
$240,00
Game Type
Video Slots
Buy FreeSpin
No
SLOT STAT Data
- SRP Statistical Return Percentage
- 75,10%
- Hit Rate Win frequency
- 12,44%
- Median Volatility Risk Level: (500) Low
(500–1500) Medium
(2000) High - 1 930,56
- Median Max Win Typical big hit size
- 239,1×
- Average Win Per winning spin
- 4,85×
Multipliers Distribution
2× 45,99%
10× 7,30%
50× 0,73%
100× 0,73%
Bonus Rounds
Based on 1 000 paid spins · bonuses: 8 Catching the bonus vs buying it
Spins to bonus
~125
Paid spins per bonus on average
Spent before bonus
71,9× bet
Base game loss per bonus, avg
Avg bonus payout
46,0× bet
Average bonus round win
Latest bonuses
| # | After spins | Free spins | Win |
|---|---|---|---|
| 1 | 110 | 11 | 2,5× |
| 2 | 61 | 12 | 26,0× |
| 3 | 136 | 14 | 8,4× |
| 4 | 188 | 10 | 0,9× |
| 5 | 298 | 12 | 2,5× |
Provider RTP
96,51%
Return to Player
Our SRP
75,10%
Statistical Return Percentage
Hit Rate
12,44%
Win frequency
Data based on 1,101 spins Table shows average and median values for 1 day *How we calculate these metrics (see Method.)
SLOT STAT Data
- SRP Statistical Return Percentage
- 88,45%
- Hit Rate Win frequency
- 21,07%
- Median Volatility Risk Level: (500) Low
(500–1500) Medium
(2000) High - 1 739,38
- Median Max Win Typical big hit size
- 239,1×
- Average Win Per winning spin
- 3,46×
Multipliers Distribution
2× 24,91%
10× 4,69%
50× 1,02%
100× 0,71%
Bonus Rounds
Based on 1 000 paid spins · bonuses: 8 Catching the bonus vs buying it
Spins to bonus
~125
Paid spins per bonus on average
Spent before bonus
71,9× bet
Base game loss per bonus, avg
Avg bonus payout
46,0× bet
Average bonus round win
Latest bonuses
| # | After spins | Free spins | Win |
|---|---|---|---|
| 1 | 110 | 11 | 2,5× |
| 2 | 61 | 12 | 26,0× |
| 3 | 136 | 14 | 8,4× |
| 4 | 188 | 10 | 0,9× |
| 5 | 298 | 12 | 2,5× |
Provider RTP
96,51%
Return to Player
Our SRP
88,45%
Statistical Return Percentage
Hit Rate
21,07%
Win frequency
Data based on 8,777 spins Table shows average and median values for 7 days *How we calculate these metrics (see Method.)
SLOT STAT Data
- SRP Statistical Return Percentage
- 87,00%
- Hit Rate Win frequency
- 21,81%
- Median Volatility Risk Level: (500) Low
(500–1500) Medium
(2000) High - 1 579,03
- Median Max Win Typical big hit size
- 184,6×
- Average Win Per winning spin
- 3,21×
Multipliers Distribution
2× 23,11%
10× 4,40%
50× 0,93%
100× 0,63%
Bonus Rounds
Based on 1 000 paid spins · bonuses: 8Catching the bonus vs buying it
Spins to bonus
~125
Paid spins per bonus on average
Spent before bonus
71,9× bet
Base game loss per bonus, avg
Avg bonus payout
46,0× bet
Average bonus round win
Latest bonuses
| # | After spins | Free spins | Win |
|---|---|---|---|
| 1 | 110 | 11 | 2,5× |
| 2 | 61 | 12 | 26,0× |
| 3 | 136 | 14 | 8,4× |
| 4 | 188 | 10 | 0,9× |
| 5 | 298 | 12 | 2,5× |
Provider RTP
96,51%
Return to Player
Our SRP
87,00%
Statistical Return Percentage
Hit Rate
21,81%
Win frequency
Data based on 38,127 spins Table shows average and median values for 30 days *How we calculate these metrics (see Method.)
SLOT STAT Data
- SRP Statistical Return Percentage
- 92,35%
- Hit Rate Win frequency
- 21,66%
- Median Volatility Risk Level: (500) Low
(500–1500) Medium
(2000) High - 1 420,81
- Median Max Win Typical big hit size
- 180,5×
- Average Win Per winning spin
- 3,40×
Multipliers Distribution
2× 22,68%
10× 4,54%
50× 0,99%
100× 0,59%
500× 0,02%
Bonus Rounds
Based on 1 000 paid spins · bonuses: 8 Catching the bonus vs buying it
Spins to bonus
~125
Paid spins per bonus on average
Spent before bonus
71,9× bet
Base game loss per bonus, avg
Avg bonus payout
46,0× bet
Average bonus round win
Latest bonuses
| # | After spins | Free spins | Win |
|---|---|---|---|
| 1 | 110 | 11 | 2,5× |
| 2 | 61 | 12 | 26,0× |
| 3 | 136 | 14 | 8,4× |
| 4 | 188 | 10 | 0,9× |
| 5 | 298 | 12 | 2,5× |
Provider RTP
96,51%
Return to Player
Our SRP
92,35%
Statistical Return Percentage
Hit Rate
21,66%
Win frequency
Data based on 114,509 spins Table shows average and median values for 90 days *How we calculate these metrics (see Method.)
Live RTP The Dog House
RTP (%)
The Dog House Stake Calculator
Parameters
Calculation method
Play style
Calculation Result
Optimal bet per spin — Bankroll, planned number of spins, maximum allowed drawdown
Chance of a profitable session —
Estimated session loss —
If the slot’s minimum bet is higher than the recommended stake, choose a game with a lower minimum bet, or increase your bankroll or maximum acceptable drawdown.
 Star Joker
 Buffalo King
 Zeus vs Hades
 Rainbow Gold
 Legacy of Egypt
 Fruit Party
 Candy Jar Clusters
 Ripe Rewards
 Buffalo King Megaways
 Fire Joker
 5 Lions Megaways 2
 The Ultimate 5
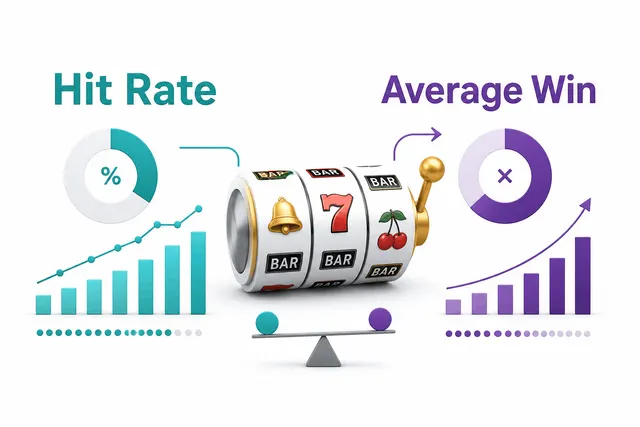 Hit Rate and Average Win in Slots Explained
 What are RTP, eRTP, and SRP in slots?
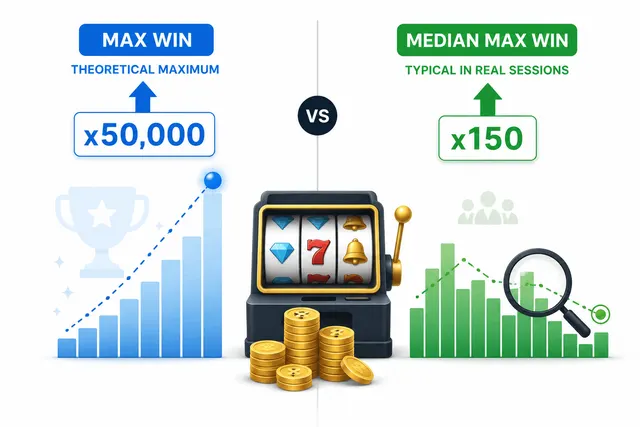 What Are Max Win and Median Max Win in Slots?
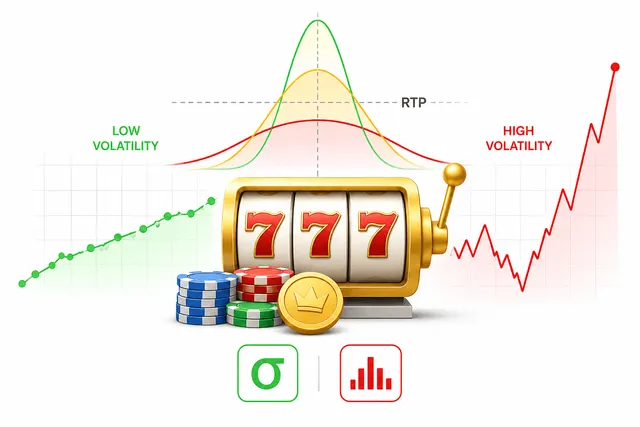 Volatility and Variance in Slots: What They Are and How They Affect Gameplay