

Fruit Party Slot Review
The slot Fruit Party offers a juicy fruit theme with a 7×7 cluster-pays format and random 2x multipliers that multiply together up to 256x. The bonus game is triggered by three or more Scatter symbols, awarding 10 free spins with an increased chance of multipliers up to 4x, and additional Scatter symbols allow the feature to retrigger. Here you'll find a free Fruit Party demo, along with Live RTP, win statistics and a calculator to plan your stakes.
Play Fruit Party Demo
Claim 500% Bonus up to 500 FS
Fruit Party Slot Stats
Provider Data
Min Bet
$0,20
Max Bet
$240,00
Game Type
Video Slots
Buy FreeSpin
Yes
SLOT STAT Data
- SRP Statistical Return Percentage
- 60,25%
- Hit Rate Win frequency
- 12,52%
- Median Volatility Risk Level: (500) Low
(500–1500) Medium
(2000) High - 753,38
- Median Max Win Typical big hit size
- 73,3×
- Average Win Per winning spin
- 4,09×
Multipliers Distribution
2× 39,53%
10× 10,85%
50× 0,78%
Bonus Rounds
Based on 1 000 paid spins · bonuses: 3 Catching the bonus vs buying it
Spins to bonus
~333
Paid spins per bonus on average
Spent before bonus
185,4× bet
Base game loss per bonus, avg
Avg bonus payout
84,2× bet
Average bonus round win
Latest bonuses
| # | After spins | Free spins | Win |
|---|---|---|---|
| 1 | 6 | 10 | 42,6× |
| 2 | 431 | 10 | 107,3× |
| 3 | 466 | 10 | 102,7× |
⚠ Bonuses recorded so far: 3. Values will become more accurate as data grows.
Provider RTP
96,50%
Return to Player
Our SRP
60,25%
Statistical Return Percentage
Hit Rate
12,52%
Win frequency
Data based on 1,030 spins Table shows average and median values for 1 day *How we calculate these metrics (see Method.)
SLOT STAT Data
- SRP Statistical Return Percentage
- 111,67%
- Hit Rate Win frequency
- 27,54%
- Median Volatility Risk Level: (500) Low
(500–1500) Medium
(2000) High - 753,38
- Median Max Win Typical big hit size
- 73,3×
- Average Win Per winning spin
- 3,55×
Multipliers Distribution
2× 20,34%
10× 3,94%
50× 0,44%
100× 0,22%
500× 0,11%
Bonus Rounds
Based on 2 000 paid spins · bonuses: 5 Catching the bonus vs buying it
Spins to bonus
~400
Paid spins per bonus on average
Spent before bonus
225,6× bet
Base game loss per bonus, avg
Avg bonus payout
73,5× bet
Average bonus round win
Latest bonuses
| # | After spins | Free spins | Win |
|---|---|---|---|
| 1 | 6 | 10 | 42,6× |
| 2 | 431 | 10 | 107,3× |
| 3 | 466 | 10 | 102,7× |
| 4 | 554 | 10 | 99,2× |
| 5 | 95 | 10 | 15,9× |
Provider RTP
96,50%
Return to Player
Our SRP
111,67%
Statistical Return Percentage
Hit Rate
27,54%
Win frequency
Data based on 8,987 spins Table shows average and median values for 7 days *How we calculate these metrics (see Method.)
SLOT STAT Data
- SRP Statistical Return Percentage
- 116,21%
- Hit Rate Win frequency
- 28,16%
- Median Volatility Risk Level: (500) Low
(500–1500) Medium
(2000) High - 1 093,95
- Median Max Win Typical big hit size
- 157,9×
- Average Win Per winning spin
- 3,13×
Multipliers Distribution
2× 16,15%
10× 2,93%
50× 0,68%
100× 0,33%
500× 0,05%
Bonus Rounds
Based on 2 000 paid spins · bonuses: 5Catching the bonus vs buying it
Spins to bonus
~400
Paid spins per bonus on average
Spent before bonus
225,6× bet
Base game loss per bonus, avg
Avg bonus payout
73,5× bet
Average bonus round win
Latest bonuses
| # | After spins | Free spins | Win |
|---|---|---|---|
| 1 | 6 | 10 | 42,6× |
| 2 | 431 | 10 | 107,3× |
| 3 | 466 | 10 | 102,7× |
| 4 | 554 | 10 | 99,2× |
| 5 | 95 | 10 | 15,9× |
Provider RTP
96,50%
Return to Player
Our SRP
116,21%
Statistical Return Percentage
Hit Rate
28,16%
Win frequency
Data based on 41,067 spins Table shows average and median values for 30 days *How we calculate these metrics (see Method.)
SLOT STAT Data
- SRP Statistical Return Percentage
- 93,03%
- Hit Rate Win frequency
- 28,21%
- Median Volatility Risk Level: (500) Low
(500–1500) Medium
(2000) High - 949,94
- Median Max Win Typical big hit size
- 151,3×
- Average Win Per winning spin
- 2,42×
Multipliers Distribution
2× 15,39%
10× 2,49%
50× 0,60%
100× 0,30%
500× 0,02%
Bonus Rounds
Based on 2 000 paid spins · bonuses: 5 Catching the bonus vs buying it
Spins to bonus
~400
Paid spins per bonus on average
Spent before bonus
225,6× bet
Base game loss per bonus, avg
Avg bonus payout
73,5× bet
Average bonus round win
Latest bonuses
| # | After spins | Free spins | Win |
|---|---|---|---|
| 1 | 6 | 10 | 42,6× |
| 2 | 431 | 10 | 107,3× |
| 3 | 466 | 10 | 102,7× |
| 4 | 554 | 10 | 99,2× |
| 5 | 95 | 10 | 15,9× |
Provider RTP
96,50%
Return to Player
Our SRP
93,03%
Statistical Return Percentage
Hit Rate
28,21%
Win frequency
Data based on 124,814 spins Table shows average and median values for 90 days *How we calculate these metrics (see Method.)
Live RTP Fruit Party
RTP (%)
Fruit Party Stake Calculator
Parameters
Calculation method
Play style
Calculation Result
Optimal bet per spin — Bankroll, planned number of spins, maximum allowed drawdown
Chance of a profitable session —
Estimated session loss —
If the slot’s minimum bet is higher than the recommended stake, choose a game with a lower minimum bet, or increase your bankroll or maximum acceptable drawdown.
 Book of Tut Megaways
 Demon
 Empty the Bank
 Legacy of Egypt
 Gold Party
 Gem Trio
 Wild West Duels
 Fire Stampede
 Sweet Bonanza
 Bounty Gold
 Candy Jar Clusters
 The Dog House Megaways
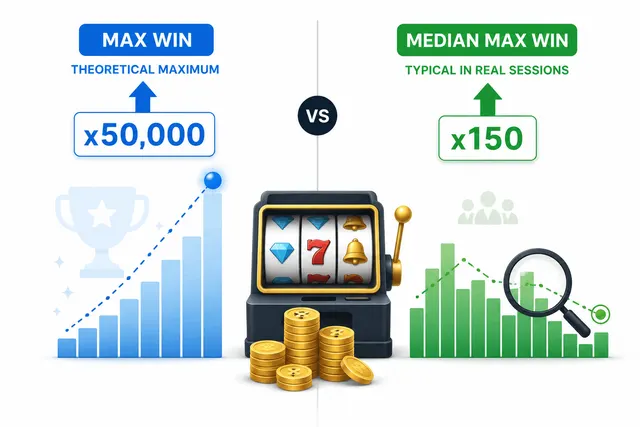 What Are Max Win and Median Max Win in Slots?
 What are RTP, eRTP, and SRP in slots?
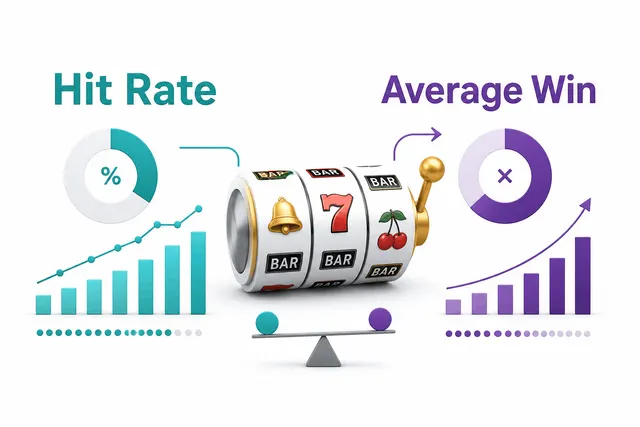 Hit Rate and Average Win in Slots Explained
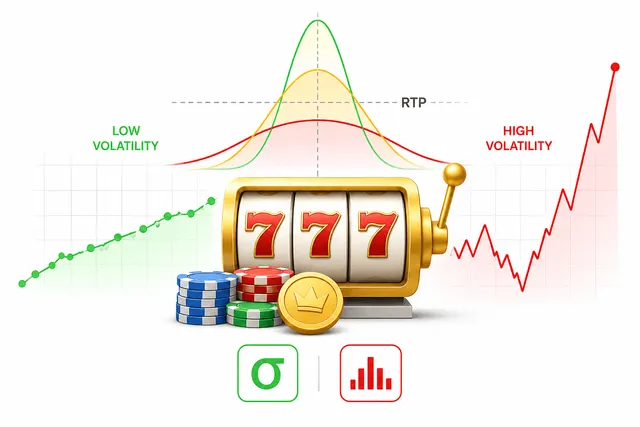 Volatility and Variance in Slots: What They Are and How They Affect Gameplay