Hit Rate and Average Win in Slots Explained
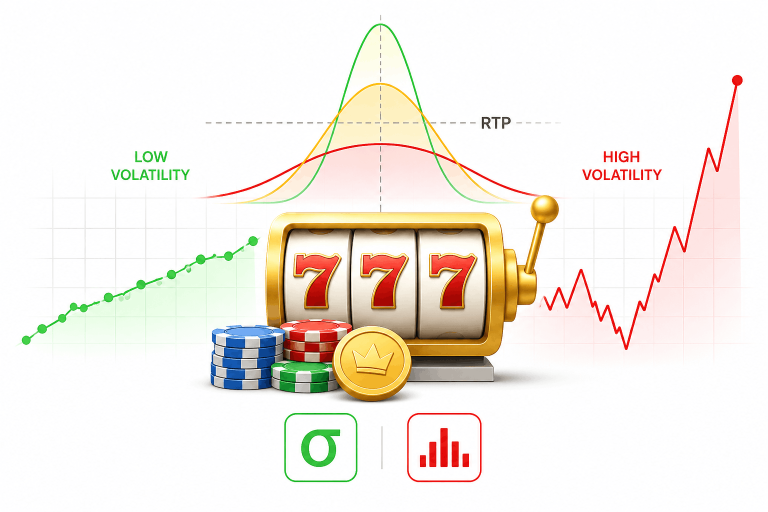
RTP shows a slot’s theoretical return over the long run, but it says almost nothing about how payouts are actually distributed during gameplay. Two slots can both have a 96% RTP yet feel completely different: one may constantly land small hits, while the other stays quiet for long stretches before dropping occasional big wins.
That’s why two key metrics are used to analyze a slot’s payout structure: Hit Rate and Average Win. Together, they help players understand the game’s rhythm, drawdown patterns, and bankroll requirements.
What Is Hit Rate
Hit Rate is the percentage of winning spins out of the total number of spins.
The formula looks like this:
Hit Rate = (Winning Spins / Total Spins) × 100%
Where:
If a slot produces 300 winning spins over a sample of 1,000 spins:
Hit Rate = (300 / 1000) × 100% = 30%
This means the slot pays out on roughly every third spin.
It’s important to understand that Hit Rate counts any positive payout, even the smallest one. Because of that, a high Hit Rate does not automatically mean high profitability or a high RTP.
From a player experience perspective, Hit Rate shapes the “density” of gameplay:
Example of a High Hit Rate
Sweet Bonanza has a Hit Rate of 29.95%.
This makes the slot feel visually more “active”:
However, most of these wins remain relatively small.
What Is Average Win
Average Win shows the average size of a winning spin.
The formula:
Average Win = Total Win Amount / Winning Spins
Where:
For example, if a slot paid a total of 1,000x bet over 200 winning spins:
Average Win = 1000 / 200 = 5×
This means that each winning spin paid an average of 5x the bet.
Average Win is not about frequency, but about the “weight” of each winning event:
At the same time, a high Average Win does not necessarily make a slot more comfortable to play. Such models are usually associated with:
Example of a High Average Win
Big Bass Bonanza has an Average Win of 7.83x the bet.
This is noticeably higher than in more hit-frequency-oriented slots and points to a model where individual wins carry more weight but occur much less often.
How Hit Rate and Average Win Work Together
These two metrics are closely connected through a slot’s payout distribution structure. In simplified terms, a slot’s behavior can be viewed as a combination of:
That’s why slots often show an inverse relationship:
a high Hit Rate is usually paired with a lower Average Win;
a low Hit Rate is often compensated by heavier payouts.
For example:
High-Frequency Profile
0,30 × 2,2 ≈ 0,66
The slot produces wins frequently, but most payouts remain relatively small.
Low-Hit, Heavy-Payout Profile
0,11 × 7,8 ≈ 0,86
Wins occur less often, but the average size of each hit is significantly larger.
Important: this is not a calculation of the actual RTP, but simply an illustration of how payout structures differ between slot types.
These values are not intended to reproduce the real RTP with precision, but they clearly demonstrate how win frequency and payout weight contribute differently across slots with different payout profiles.
Final RTP and SRP are also influenced by:
Still, the combination of Hit Rate and Average Win gives a strong indication of how a game behaves: whether the slot tends to sustain the balance through frequent small returns or revolves around rare, heavy hits.

Common Slot Profiles
High Hit Rate + Low Average Win
Sweet Bonanza
Provider Data
SLOT STAT Data
Multipliers Distribution
This type of profile typically means:
The slot regularly returns part of the bet, which makes sessions feel more stable and less volatile. However, most wins are not large enough to grow the balance quickly.
Games with this profile are usually better suited for:
Medium Hit Rate + Medium Average Win
Provider Data
SLOT STAT Data
Multipliers Distribution
This is a more balanced model. The slot is no longer built purely around small returns, but it also doesn’t demand extreme patience. The player gets:
Such profiles are often seen as a compromise between:
Low Hit Rate + High Average Win
Big Bass Bonanza
Provider Data
SLOT STAT Data
Multipliers Distribution
This is the profile of a heavier slot:
In games like this, a significant share of the RTP is often concentrated inside:
As a result, individual wins carry much more weight, but they occur far less frequently. This type of profile usually requires:
What This Means for Players and Bankroll Management
Hit Rate and Average Win directly affect bankroll behavior and the overall feel of gameplay.
A high Hit Rate:
A high Average Win:
These profiles can be simplified as follows:
| Profile | Gameplay Rhythm | Bankroll Pressure |
| High Hit Rate | Frequent small returns | Lower |
| Balanced Profile | Balanced pacing | Medium |
| High Average Win | Rare heavy payouts | Higher |

That’s why RTP alone provides only a partial picture without the payout structure behind it.
Two slots with the same RTP may require completely different approaches to:
For SLOT STAT analytics, the combination of Hit Rate and Average Win is important because it shows not only how much a slot returns, but how that return is distributed throughout the playing session.