

Wild West Gold Slot Review
The cowboy western Wild West Gold takes players to a 5×4 grid filled with revolvers, gold, and outlaws. Wild symbols land with 2x, 3x or 5x multipliers, which stack when multiple wilds appear at once, while three scatters trigger a bonus with 8 free spins, where extra scatters award up to 20 more spins and multiplier wilds stay sticky throughout the round. Here you can try a free-to-play demo, explore win statistics and live RTP, and calculate your bet with the built-in calculator.
Play Wild West Gold Demo
Claim 500% Bonus up to 500 FS
Wild West Gold Slot Stats
Provider Data
Min Bet
$0,20
Max Bet
$240,00
Game Type
Video Slots
Buy FreeSpin
Yes
SLOT STAT Data
- SRP Statistical Return Percentage
- 103,19%
- Hit Rate Win frequency
- 12,73%
- Median Volatility Risk Level: (500) Low
(500–1500) Medium
(2000) High - 1 112,55
- Median Max Win Typical big hit size
- 79,4×
- Average Win Per winning spin
- 6,88×
Multipliers Distribution
2× 54,41%
10× 17,65%
50× 1,47%
Bonus Rounds
Based on 1 000 paid spins · bonuses: 6 Catching the bonus vs buying it
Spins to bonus
~167
Paid spins per bonus on average
Spent before bonus
96,6× bet
Base game loss per bonus, avg
Avg bonus payout
101,0× bet
Average bonus round win
Latest bonuses
| # | After spins | Free spins | Win |
|---|---|---|---|
| 1 | 109 | 8 | 23,3× |
| 2 | 110 | 12 (8+4) | 273,3× |
| 3 | 68 | 12 (8+4) | 22,2× |
| 4 | 343 | 8 | 75,4× |
| 5 | 59 | 12 (8+4) | 161,8× |
Provider RTP
96,51%
Return to Player
Our SRP
103,19%
Statistical Return Percentage
Hit Rate
12,73%
Win frequency
Data based on 1,068 spins Table shows average and median values for 1 day *How we calculate these metrics (see Method.)
SLOT STAT Data
- SRP Statistical Return Percentage
- 111,85%
- Hit Rate Win frequency
- 23,14%
- Median Volatility Risk Level: (500) Low
(500–1500) Medium
(2000) High - 1 476,02
- Median Max Win Typical big hit size
- 251,4×
- Average Win Per winning spin
- 4,10×
Multipliers Distribution
2× 27,78%
10× 4,97%
50× 1,04%
100× 0,50%
500× 0,04%
Bonus Rounds
Based on 1 000 paid spins · bonuses: 6 Catching the bonus vs buying it
Spins to bonus
~167
Paid spins per bonus on average
Spent before bonus
96,6× bet
Base game loss per bonus, avg
Avg bonus payout
101,0× bet
Average bonus round win
Latest bonuses
| # | After spins | Free spins | Win |
|---|---|---|---|
| 1 | 109 | 8 | 23,3× |
| 2 | 110 | 12 (8+4) | 273,3× |
| 3 | 68 | 12 (8+4) | 22,2× |
| 4 | 343 | 8 | 75,4× |
| 5 | 59 | 12 (8+4) | 161,8× |
Provider RTP
96,51%
Return to Player
Our SRP
111,85%
Statistical Return Percentage
Hit Rate
23,14%
Win frequency
Data based on 8,913 spins Table shows average and median values for 7 days *How we calculate these metrics (see Method.)
SLOT STAT Data
- SRP Statistical Return Percentage
- 100,69%
- Hit Rate Win frequency
- 23,25%
- Median Volatility Risk Level: (500) Low
(500–1500) Medium
(2000) High - 1 672,57
- Median Max Win Typical big hit size
- 248,6×
- Average Win Per winning spin
- 3,44×
Multipliers Distribution
2× 22,38%
10× 3,91%
50× 0,82%
100× 0,50%
500× 0,02%
Bonus Rounds
Based on 1 000 paid spins · bonuses: 6Catching the bonus vs buying it
Spins to bonus
~167
Paid spins per bonus on average
Spent before bonus
96,6× bet
Base game loss per bonus, avg
Avg bonus payout
101,0× bet
Average bonus round win
Latest bonuses
| # | After spins | Free spins | Win |
|---|---|---|---|
| 1 | 109 | 8 | 23,3× |
| 2 | 110 | 12 (8+4) | 273,3× |
| 3 | 68 | 12 (8+4) | 22,2× |
| 4 | 343 | 8 | 75,4× |
| 5 | 59 | 12 (8+4) | 161,8× |
Provider RTP
96,51%
Return to Player
Our SRP
100,69%
Statistical Return Percentage
Hit Rate
23,25%
Win frequency
Data based on 38,832 spins Table shows average and median values for 30 days *How we calculate these metrics (see Method.)
SLOT STAT Data
- SRP Statistical Return Percentage
- 95,50%
- Hit Rate Win frequency
- 23,27%
- Median Volatility Risk Level: (500) Low
(500–1500) Medium
(2000) High - 1 434,06
- Median Max Win Typical big hit size
- 197,8×
- Average Win Per winning spin
- 3,18×
Multipliers Distribution
2× 21,34%
10× 3,86%
50× 0,86%
100× 0,47%
500× 0,03%
Bonus Rounds
Based on 1 000 paid spins · bonuses: 6 Catching the bonus vs buying it
Spins to bonus
~167
Paid spins per bonus on average
Spent before bonus
96,6× bet
Base game loss per bonus, avg
Avg bonus payout
101,0× bet
Average bonus round win
Latest bonuses
| # | After spins | Free spins | Win |
|---|---|---|---|
| 1 | 109 | 8 | 23,3× |
| 2 | 110 | 12 (8+4) | 273,3× |
| 3 | 68 | 12 (8+4) | 22,2× |
| 4 | 343 | 8 | 75,4× |
| 5 | 59 | 12 (8+4) | 161,8× |
Provider RTP
96,51%
Return to Player
Our SRP
95,50%
Statistical Return Percentage
Hit Rate
23,27%
Win frequency
Data based on 117,121 spins Table shows average and median values for 90 days *How we calculate these metrics (see Method.)
Live RTP Wild West Gold
RTP (%)
Wild West Gold Stake Calculator
Parameters
Calculation method
Play style
Calculation Result
Optimal bet per spin — Bankroll, planned number of spins, maximum allowed drawdown
Chance of a profitable session —
Estimated session loss —
If the slot’s minimum bet is higher than the recommended stake, choose a game with a lower minimum bet, or increase your bankroll or maximum acceptable drawdown.
 Big Bass Splash
 Sweet Bonanza 1000
 Lucky Bull
 Aviator
 Dance Party
 Pirates Pub
 Demon
 5 Lions Megaways
 Ripe Rewards
 Big Bass Bonanza 1000
 7 Monkeys
 Gates of Olympus Super Scatter
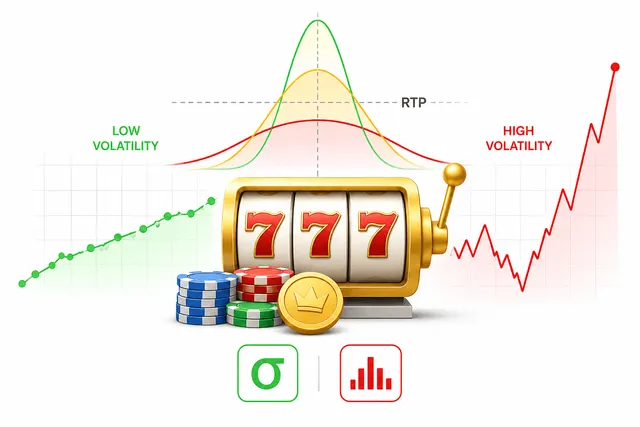 Volatility and Variance in Slots: What They Are and How They Affect Gameplay
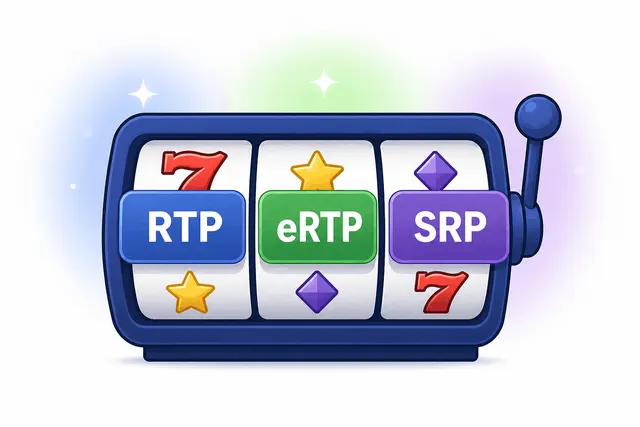 What are RTP, eRTP, and SRP in slots?
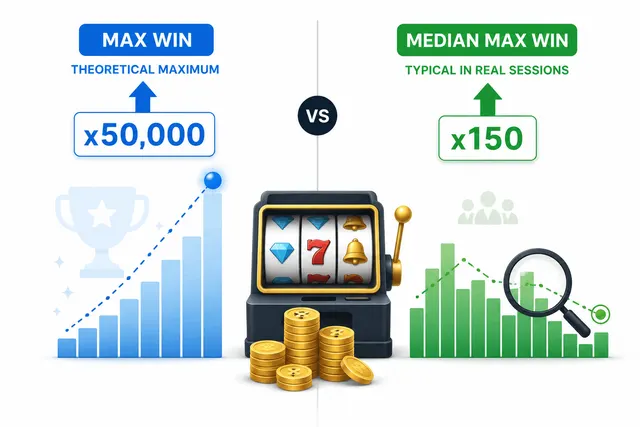 What Are Max Win and Median Max Win in Slots?
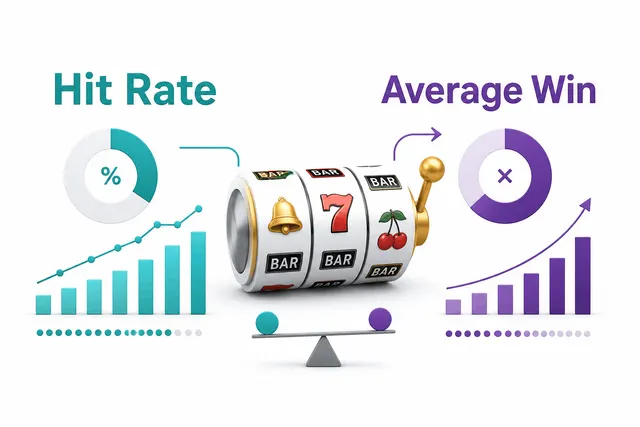 Hit Rate and Average Win in Slots Explained